志工們配備了美國魚類及野生動物管理局(USFWS)的鳥屍採集許可。散步結束後,志工會把鳥屍冰在家裡的冷凍庫以防腐化,每一季都會將蒐集到的鳥屍送到史密森尼國家自然歷史博物館(Smithsonian's National Museum of Natural History)分析。
博物館鳥類專家布萊恩.史密特(Brian K. Schmidt)負責處理從巴爾的摩和華盛頓熄燈計畫(Lights Out Washington D.C.)送來的樣本。其中一部分會被送往各個自然歷史博物館進行疾病與死因研究。其他腐爛嚴重或被老鼠和螞蟻捷足先登的鳥屍,則會被丟進垃圾桶。即便如此,史密特仍很感激志工的努力,「我們總是歡迎人們把死鳥送來。」史密特說。
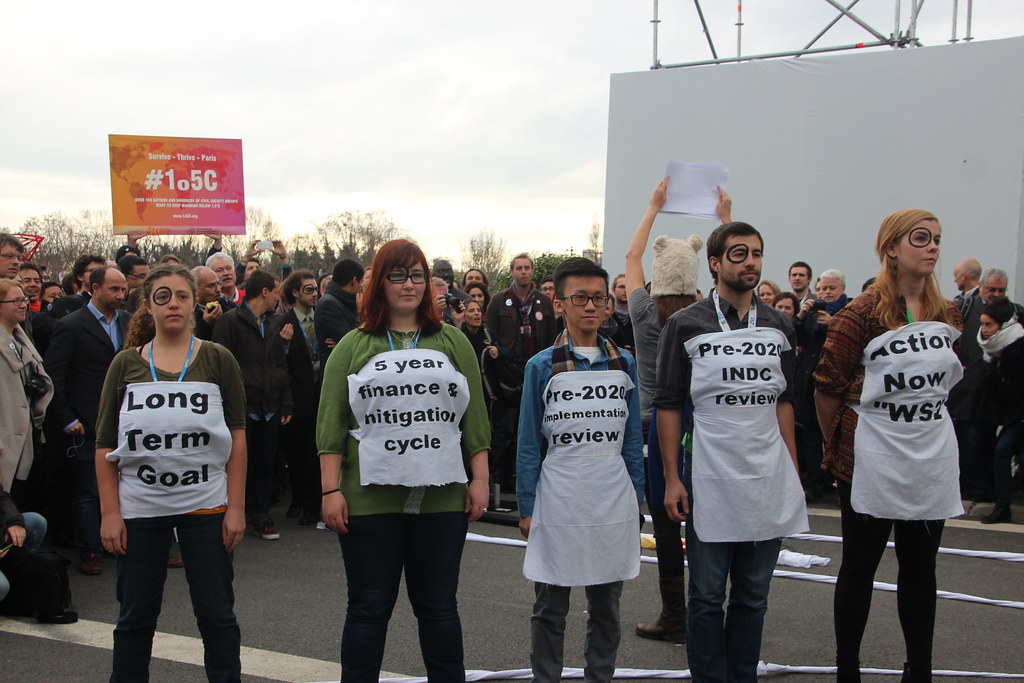
圖為華盛頓熄燈計畫在2013年遷徙季節時,蒐集到因撞擊建築物而死的鳥屍。志工們蒐集到的鳥屍也曾在博物館展出,讓更多民眾認識這項行動。圖片來源:USGS Bee Inventory and Monitoring Lab(CC0)。
另外,奧杜邦學會的波特蘭分會於去年招募了2500位居民,並串連13座建築物,攜手關掉不必要的城市照明。此外,馬里蘭州的帕圖森野生動物研究中心(Patuxent Wildlife Research Center)近期也替窗戶裝上由熄燈計畫志工兼藝術家琳恩.帕克斯(Lynne Parks)設計的藍色貼膜。
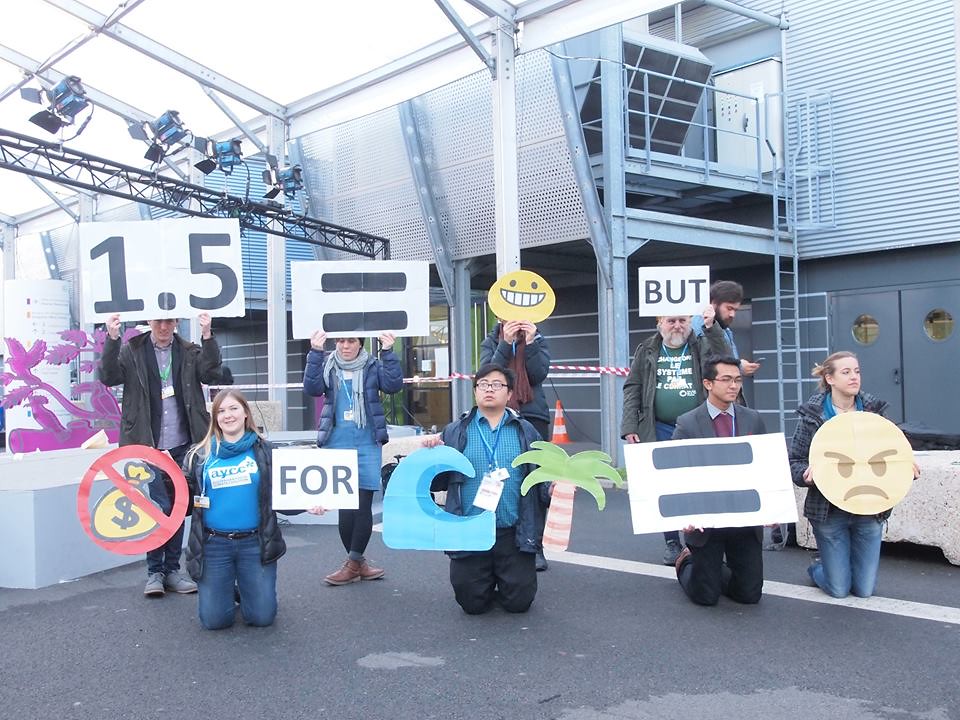
這份研究也探討了滿足全球能源需求,同時減少溫室氣體排放量以達到1.51.5℃目標的可能性。達到1.5℃目標需要全球迅速淘汰所有類型的化石燃料,或者至少淘汰沒有碳捕獲和封存(CCS)技術的化石燃料。同時還需要迅速提高使用零碳淨能源和淨負碳能源的使用,像是整合探捕獲和封存技術的生質能源(Bio-energy with carbon capture and storage,BECCS),同時實際從大氣中去除二氧化碳。
New scenarios show how the world could limit warming to 1.5C in 2100
In the 2015 Paris Agreement on climate change, nearly every country on Earth pledged to keeping global temperatures “well below” 2C above pre-industrial levels and to “pursue efforts to limit the temperature increase even further to 1.5C”.
However, at the time, scientists had only modelled energy system and carbon mitigation pathways to achieve the 2C target. Few studies had examined how the world might limit warming to 1.5C.
Now a paper in Nature Climate Change presents the results from a new modelling exercise using six different “integrated assessment models” (IAMs) to limit global temperatures in 2100 to below 1.5C.
The results suggest that 1.5C is achievable if global emissions peak in the next few years and massive amounts of carbon are sucked out of the atmosphere in the second half of the century through a proposed technology known as bioenergy with carbon capture and storage (BECCS).
島國心聲,COP21 升溫不超過1.5度。攝影:賴慧玲。
Defining the 1.5C target
One challenge with the goal of limiting warming to 1.5C above pre-industrial levels is that it was not clearly defined in the text of the Paris Agreement. For example, scientists disagree on what, exactly, pre-industrial temperatures were and how best to define them, as well as what dataset to use.
There is also not a clear consensus if the target should be to aim to have even odds of the world reaching 1.5C warming by 2100, or seek to try and avoid having temperatures exceed 1.5C by aiming for an even lower warming amount. Because uncertainties in climate sensitivity mean that we could have anything between 1.5C and 4.5C warming per doubling of CO2 emissions, scientists tend to plan to avoid the worst case where climate sensitivity ends up being on the higher end of the range.
In the case of the 2C target, the Paris Agreement’s “well below” language has been interpreted as ensuring that there is no more than a 33% chance of exceeding 2C – and, therefore, a 66% chance of staying below it. But the 1.5C target could be interpreted as either aiming for a 50% chance of staying below 1.5C, or a 66% chance similar to the 2C target. This may sound like a small distinction, but it has large impacts on the resulting carbon budget and ease of meeting the target.
In their new paper, a team of 23 energy researchers choose the stricter interpretation of the target, aiming for a 66% chance of avoiding more than 1.5C warming in the year 2100. However, they allow for temperatures to exceed 1.5C over the course of the century as long as they fall back down to below 1.5C by the year 2100. This is known as an “overshoot” scenario.
1.5C only possible in some future pathways
To assess viable pathways to limit warming to 1.5C, the researchers use the new Shared Socioeconomic Pathways (SSPs) developed in preparation for the next Intergovernmental Panel on Climate Change (IPCC) assessment report due early next decade. These SSPs – which Carbon Brief will explore in more depth in the coming weeks – present five possible future worlds that differ in their population, economic growth, energy demand, equality and other factors.
Each world could have multiple different climate trajectories, though some will have a much easier time reducing emissions than others. The new climate trajectory associated with avoiding more than 1.5C warming in 2100 is called Representative Concentration Pathway 1.9 (“RCP1.9”), which is a world where the radiative forcing from greenhouse gases is limited to no more than 1.9 watts per meter squared (W/m2) above pre-industrial levels. This is lower than the range of RCPs previously used by climate modellers, which went from 2.6 up to 8.5W/m2.
The six IAMs all find viable 1.5C scenarios in SSP1, which is a pathway that focuses on “inclusive and sustainable development”. Four of the six models find pathways in SSP2, which is a middle of the road scenario where trends largely follow historical patterns. No models show viable 1.5C pathways in SSP3, which is a world of “regional rivalry” and “resurgent nationalism” with little international cooperation.
Finally, only one of the models has a 1.5C pathway in SSP4, which is a world of “high inequality”, while two models have viable pathways in SSP5, a world of “rapid economic growth” and “energy intensive lifestyles”.
Emissions must peak quickly
To limit warming to below 1.5C, all the models that the researchers examined require that global emissions peak by 2020 and decline precipitously thereafter. After 2050, the world must reduce net CO2 emissions to zero and emissions must be increasingly negative throughout the second half of the 21st century.
Even with these rapid reductions, all the scenarios considered still overshoot 1.5C warming in the 2040s, before declining to around 1.3-1.4C above pre-industrial levels by 2100. Models with more rapid reductions – generally associated with SSP1 – have less temperature overshoot than those with more gradual reductions.
The figure below shows both CO2 emissions (left) and global warming above pre-industrial (right) across all the 1.5C models examined. The lines are coloured based on the SSP used.
CO2 emissions in gigatons (Gt) CO2 (left) and global mean surface temperature relative to preindustrial (right) across all RCP1.9/1.5C scenarios included in Rogelj et al 2018. Data available in the IIASA SSP database. Chart by Carbon Brief using Highcharts.
The models show a remaining 1.5C “carbon budget” from 2018 to 2100 of between -175 and 400 gigatonnes of CO2 (GtCO2). This range is consistent with estimates from the IPCC’s 5th Assessment Report.
The wide range is largely a result of differences in emissions of non-CO2 greenhouse gases, such as methane and nitrous oxide, which vary by a factor of between two and three across the models by 2100. Some models with higher non-CO2 emissions have a remaining carbon budget of less than zero, requiring more CO2 to be removed from the atmosphere than added by the end of the century. In these simulations, the carbon budget for 1.5C has already been used up.
The central estimate across the models is that the remaining 2018-2100 carbon budget is around 230 GtCO2. At the current rate of emissions, this would allow roughly six years until the entire 1.5C budget is exhausted, with a range of zero to 11 years across all the models.
Replacing fossil fuels with renewables
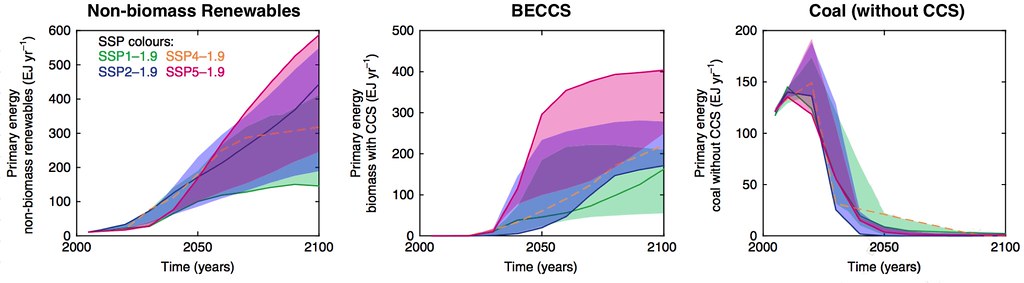
The study explores the different ways that global energy needs can be met, while also cutting GHG emissions in order to meet the 1.5C goal. Limiting warming to below 1.5C requires that the world rapidly phase out all types of fossil fuels – or at least those without accompanying carbon capture and storage (CCS). At the same time, the world need to quickly ramp up the use of zero and net-negative carbon energy sources – things such as BECCS that generate energy while actually removing CO2 from the atmosphere.
The figure below shows the use of renewables (left), net-negative BECCS (centre) and coal without CCS (right) across all the 1.5C models. The colours show which SSPs the model simulations use.
Global primary energy use in exajoules (EJ) for non-biomass renewables (left), BECCS (center), and coal without CCS (right) across all RCP1.9/1.5C scenarios. Adapted from Figure 2 in Rogelj et al 2018.
In most models, overall energy use actually increases between 2018 and 2100, by between -22% and +83%, with a central increase of 22%.
However, the models also show that energy efficiency is quite important in the short term – at least, while most energy comes from fossil fuels. This is particularly important in the transportation and building sectors, where rapid decarbonisation is more difficult than in power generation.
The models show an estimated 60-80% of all energy coming from renewables globally by 2050. Some models also show a much larger role for nuclear power, though others do not.
To limit warming to 1.5C, coal use without carbon capture declines by around 80% by 2040, with oil similarly mostly phased out by 2060. This would require most petrol or diesel vehicles to be phased out by 2060, with electric or other low-carbon alternative fuel vehicles making up the vast majority of sales well before that date. Future natural gas use is more mixed in the models, with some showing increases and some decreases by mid-century.
Emissions must go negative
Negative emissions are needed in the latter half of the century to pull the extra CO2 out of the atmosphere. This is because emissions cannot fall fast enough in the models to avoid exceeding the allowable carbon budget to avoid 1.5C warming.
Most of the models emit roughly 50-200% more CO2 than the allowable carbon budget over the course of the century, before pulling the extra CO2 back out.
The models assume widespread adoption of BECCS starting between 2030 and 2040 and then rapidly scaling up. By 2050, many models have BECCS producing more than 100 exajoules (EJ), roughly the same amount of energy globally as coal provides today. By 2100, BECCS will be around 200EJ compared to 300EJ for all non-biomass renewable energy.
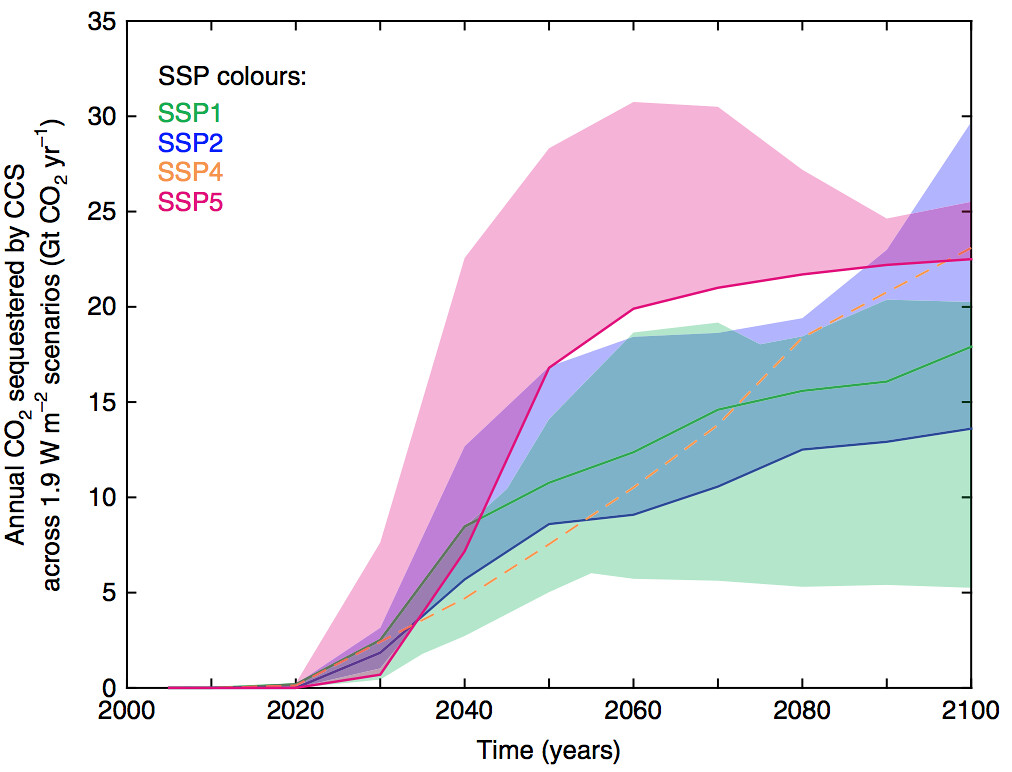
The figure below shows the amount of CO2 sequestered by CCS (both from BECCS and fossil fuels) across all the models. Carbon capture ramps up after 2020 and could be 20 GtCO2 or higher by the end of the century, which is around half of global CO2 emissions in 2018.
Annual CO2 sequestered by carbon capture and storage in gigatons (Gt) CO2 by year and SSP across all RCP1.9/1.5C scenarios. Adapted from Figure 3 in Rogelj et al 2018.
The models produce estimates of global forest cover changes between -2% and 26% between today and 2100, with most models showing significant increases in forest cover. Both BECCS and afforestation require a lot of land. Most models show a decline in global cropland scenarios roughly equal to the area currently used for agriculture across the entire European Union.
However, most of the models used in the study do not include afforestation as an explicit mitigation option, so afforestation and other “natural” negative emissions technologies could potentially play a larger role in the future. The specific technologies used for future negative emissions may be different and somewhat less reliant on BECCS, but non-BECCS approaches are largely excluded from the models due to remaining uncertainties in cost and effectiveness at scale.
Similarly, the amount of BECCS used differs quite a bit between models and across SSPs, with SSP1 requiring the least negative emissions and SSP5 requiring the most due to its slower emissions reductions and higher overall energy use.
Dr Joeri Rogelj, the paper’s lead author from the International Institute for Applied Systems Analysis (IIASA) in Austria, tells Carbon Brief:
“This indicates that a focus on sustainable lifestyles that limit energy demand can strongly reduce the reliance on BECCS.”
One interesting consequence of the 1.5C target is a reduced use of fossil fuels combined with CCS, compared to what is found in 2C scenarios. This is because fossil fuels with CCS still results in methane emissions from coal mining or gas handling, as well as CO2 emissions due to imperfect capture and leakage. These extra emissions can become too important to allow at a large scale in a 1.5C world.
Much more difficult to reach 1.5C than 2C
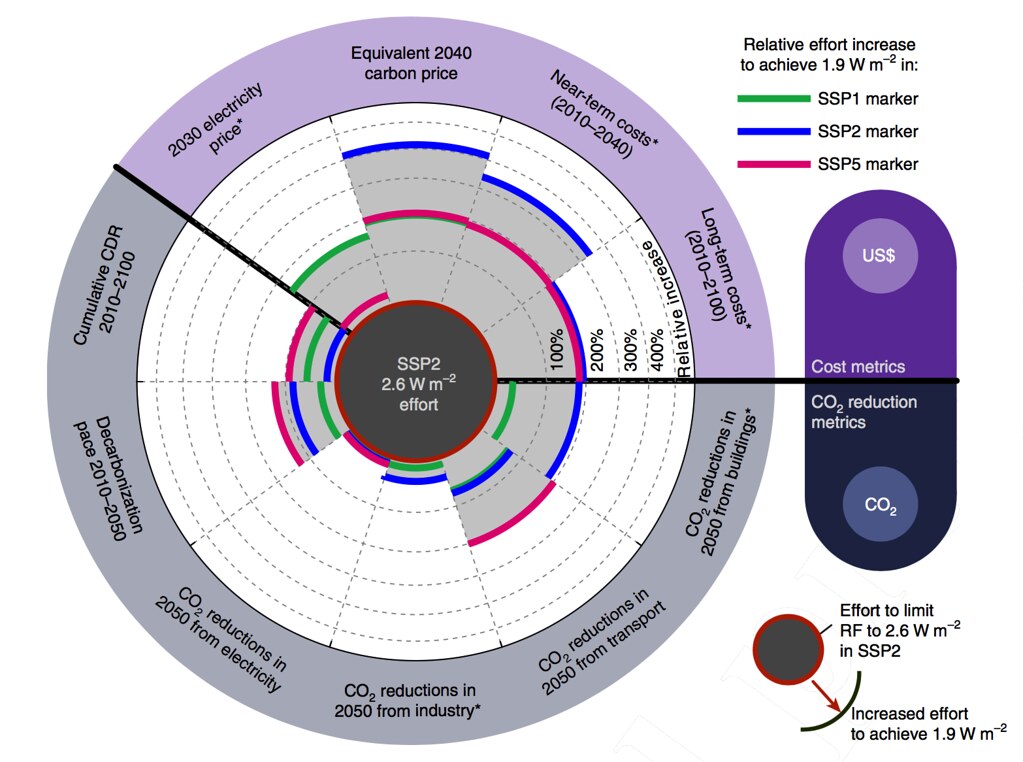
In addition to exploring the details of what it would take to limit warming to 1.5C, the paper also compares it to existing 2C scenarios across a number of different categories. The figure below shows the difference between 1.5C and 2C scenarios across both economic and CO2 reduction metrics. Each dashed line represents a 100% increase in cost or effort in a 1.5C world compared to a 2C world.
Relative increases in cost and CO2 reduction metrics for 1.5C scenarios compared to 2C scenarios for various SSPs. Each dashed line represents a 100% increase in cost or reduction amount, up to a 500% increase. Taken from figure 4 in Rogelj et al 2018.
The largest increases are in carbon prices, which must be between 200% and 400% higher, and in near-term costs, which are 200% to over 300% higher. These increases in short-term costs are driven by the more severe near-term emission reductions needed. Long-term costs are also expected to be around 200% higher.
For CO2 reduction metrics, a 1.5C world requires approximately two to three times larger reductions in CO2 from buildings and transport than in a 2C world. These sectors are more difficult to decarbonise than power generation as they involve the direct combustion of fossil fuels that are less easily replaced.
Difficult, but possible?
The new scenarios in this study are important because they show that there are possible trajectories and technological pathways that can limit warming to below 1.5C in 2100. However, all of the models included overshoot 1.5C of warming in the middle of the century. Most also rely on massive amounts of still-unproven negative emissions later in the century to allow a more feasibly gradual reduction in emissions in the near-term.
夏威夷是海洋運動與生態旅遊的天堂,卻也是全球海洋塑膠污染的重災區。該州在2015年成為美國第一個禁限用塑膠袋的州,州內兩個郡層級的地方政府去年也通過保麗龍食品容器的禁令,成為全美減塑倡議的指標場域。但是,塑膠與食品產業卻存在反對聲浪,其中一項質疑是「夏威夷的海廢都是外地漂來的,本地禁用無益於改善現況」。因此,夏威夷大學與保育團體夏威夷野生動物基金會(Hawaii Wildlife Fund ),在夏威夷大島設計一系列實驗:包含在都會區大排,攔截205天的表面垃圾;在四個地點施放1547個木製浮標(drifter),透過民眾回報位置來追蹤漂流途徑、軟體推算表層洋流輸送模式等,證明當地管理不佳的垃圾的確會隨河川逸散入海,並迅速擱淺在當地與鄰近島嶼海岸。參與實驗設計、親自划獨木舟「海拋」數百個浮標的Megan Lamson表示,這項簡單淺顯卻蘊含重要意義的研究成果,不僅發表於學術期刊[1],也成為在地減塑倡議的重要學理支持。
德國歐登堡大學研究員參考夏威夷經驗設計的實木漂流浮標(圖片:胡介申提供)
任職於Kokua Hawaii Foundation(歌手傑克強森創辦的環境教育推廣組織)、無塑夏威夷(Plastic Free Hawaii)的專案經理 Doorae Shin,則分享每次地方政府召開公聽會時,塑膠石化業者都不厭其煩,不遠千里派遣遊說專家從美國本土飛到夏威夷全程出席,顯示該地扮演骨牌效應的關鍵角色,她也呼籲眾人應為了潔淨的海洋團結一致。
企業責任,是減塑的下一步
2016年,由全球各地眾多環保團體與草根組織組成的「擺脫塑膠污染聯盟(Break Free from Plastic)」,全球統籌Von Hernandez在IMDC大會中預告,今年(2018)4月將彙編一份塑膠污染減量的完整工具包(A Global Plastic Pollution Reduction Toolkit),歡迎全世界的行動者上網訂閱。
五大環流研究所(5 Gyres Institute)分析六種不同的海岸與水下垃圾監測資料,列出20項大量污染、應優先減量、替代或禁限用的常見商品,編輯成倡議行動手冊BAN List 2.0[2]。除了延續1.0版的訴求推動地方政府修法,主要作者Marcus Eriksen也自己動手檢驗20種號稱可分解的商品與材質,經過為期兩年土壤掩埋與海水浸泡,某些商品已經分解、溶化或細碎化到肉眼無法辨識,但也有部分商品依然完好如初。新版文件更點名美國五大海廢常見品牌業者,預告生產者衍生責任(EPR, Extended Producer Responsibility)將會是未來倡議重點。
[1]Carson HS, Lamson MR, Nakashima D, Toloumu D, Hafner J, Maximenko N, McDermid KJ(2013), Tracking the sources and sink s of local marine debris in Hawai'i, Marine Environmental Research, 84 : 76-83
[2] 5 Gyres Institute (2017) Better Alternatives Now - BAN List 2.0
[3]Hardesty BD, Wilcox C(2017), A risk framework for tackling marine debris, Analytical Methods, 6:1429-1436
[4] Schuyler QA, Wilcox C, Townsend KA, Wedemeyer‐Strombel KR, Balazs G, Van Sebille E, Hardesty BD(2015), Risk analysis reveals global hotspots for marine debris ingestion by sea turtles, Global Change Biology, 22 : 567-576
[5] Deposit schemes reduce drink containers in the ocean by 40%. https://goo.gl/4WDk6B
WBCSD在2017年推出《產品組合永續性評估綱要》(Framework for portfolio sustainability assessments,PSA),4月18日推出的指南是為此計畫的延續。該機構18日發表《指南》時表示,若根據這份指南調整產品組合,化學業可以做出更好的決策,訂定更堅實的策略。包括阿克蘇諾貝爾、巴斯夫、科萊恩、科思創、帝斯曼、伊斯曼化學、贏創工業、SABIC和索爾維等企業均協力參與,幫助整個化學工業及其利害關係者評估和瞭解產品組合。運用這些指標,企業可以透過各種職能,包括研發、併購、創新、市場行銷、溝通和設計等,來提高永續性。
The World Business Council for Sustainable Development, WBCSD, is launching a first-of-its-kind guidance for the chemical industry to help the industry assess sustainability "signals" across their entire product portfolio, then steer their portfolio towards improved sustainability outcomes.
These signals include chemical hazard and exposure along the life cycle of a substance; anticipated regulatory trends; environmental and social impacts, market perception and the UN Sustainable Development Goals.
This Methodology provides specific guidance for the chemical industry that builds off the WBCSD's Framework for Portfolio Sustainability Assessments, PSAs, released in October 2017.
Companies that follow this guidance "have a higher growth rate for more sustainable solutions; provide credible communication on sustainability benefits; develop stronger customer and stakeholder relationships; reduce risks across a range of issues; and improve their corporate image," says the WBCSD.
AkzoNobel, BASF, Clariant, Covestro, DSM, Eastman Chemical, Evonik Industries, SABIC and Solvay collaborated to provide guidance that the wider chemical industry and its stakeholders can use to assess and understand the product portfolio.
Using these signals, companies can direct efforts to improve sustainability across various functions, including research and development, mergers and acquisitions, innovation, marketing, communication and design.
Chemical companies frequently come under criticism by environmental groups for producing substances that harm human health and the environment and doing so in ways that pollute the environs of their production facilities.
The German multinational chemical company BASF, for instance, is one of the world's largest producers of chemical plastic softening agents, phthalates. Friends of the Earth Germany and Greenpeace, among other groups, have criticized BASF for producing these products, since recent studies have shown that phthalates can interfere with human reproductive capacities.
BASF also attracted criticism in 2013 when the company joined chemical companies Bayer and Syngenta in challenging the European Union's decision to restrict the use of pesticides that are harmful to pollinators, such as Fipronil, which is highly toxic to bees.
Fipronil is also harmful to humans and has been linked to hormone disruption, thyroid cancer, neurotoxicity and reproductive effects in mammals.
Now, however, BASF is reaching for sustainability. In March, as monarch butterflies prepared to fly north, BASF encouraged farm families to provide a layover for them by planting milkweed habitats along the migration path as part of the company's Monarch Challenge.
"BASF is partnering with them to establish milkweed habitats in non-crop areas of their land," said Chip Shilling, BASF Sustainability Strategy Manager. "We hope programs like the Monarch Challenge can help restore and preserve the monarch population for future generations, while demonstrating how milkweed can thrive alongside modern agricultural practices."
In April, BASF and arc-net, announced a collaboration focused on using blockchain technology to capture and analyze sustainability parameters in livestock production along the value chain. arc-net is a technology company utilizing blockchain technology to provide transparency in the agri-food industry. As part of this collaboration, BASF will use its tailored calculation tool, AgBalance™ Livestock to provide science-based information on environmental impacts along the animal production value chain.
"Venturing into this collaboration with arc-net is a key milestone in our efforts to enable our customers to grow sustainably," said Alexa Beaver, Digital Innovation, BASF. "We never stop thinking about what more we can do to create valuable sustainable measures, and this project is a great step forward."
The International Council of Chemical Associations, ICCA, which represents chemical manufacturers and producers worldwide, is on board with the industry's new sustainability direction.
The ICCA has joined UN Environment's #BeatPollution initiative and commits to combatting pollution by expanding its voluntary Responsible Care program to "reduce emissions and increase global capacity to manage chemicals safely."
Although all companies testing the WBCSD guidance were found to strive for broad coverage of business activities and increased scope of reporting, no single pathway to successful implementation was identified. Instead, the guidance states, companies were found to advance in different ways towards their goal.
1. Companies may start by involving a broad range of business activities and gradually increase the scope of reporting over time.
2. Alternatively, companies may opt to introduce PSAs in a pilot business and realize an adequate level of quality and detail before further rolling out to other businesses.
3. By combining above approaches, companies may implement a roadmap which foresees in alternating upgrades in scope and granularity, with further expansions of business coverage.
4. Mergers and acquisitions may result in a temporary reduction of business coverage and/or a temporary decrease in the level detail or quality of available data.
5. Although most companies strive to achieve a high coverage of business activities with an adequate level of detail in the assessments, most companies experience that the end goal is a moving target, as stakeholder requirements change over time.
Following the release of this guidance, WBCSD says its member companies will build from these efforts through the sharing of best practices and lessons learned.


 Companies that are steering their portfolios are finding that they can make better decisions and develop more robust strategies, the WBCSD said in a statement on Tuesday, announcing the


